

A smart plug to the rescue – save energy and money
When the cost-of-living crisis hit in 2022 we thought we’d be OK. Just how bad could it get? It’s just inflation, right?
Wrong!
Our wake-up call came when energy costs shot through the roof at the same time that our fixed rate energy deal ended.
- First the cost of gas and electricity rocketed due to the war in Ukraine. That was bad enough.
- Then we learned that our energy use was way above average. Extra pain. The government’s £2,500 rate cap did nothing for us.
- And finally, we had to move from the low fixed rate deal to really expensive standard variable rates.
We would have to pay way more than £4,300 per year!
Something had to be done. We had to find a way to save energy and money. Fast.
How?
We bought a small smart plug on Amazon and set about finding every way possible to save energy and money. That purchase was the best decision we ever made.
Our January 2022 energy bill was due to be £485, but we brought it down to a costly but more affordable £267 – even after the prices increased. Not to be sniffed at! Before 2023 is over we will have saved well over a thousand pounds.
How did we do it? Read on.
This is the story of how we managed to cut our energy use drastically and keep our heads above water through the winter.
Rocketing energy prices and the end of a fixed-rate deal
It was the summer of 2022 and we were happily on a Fix-and-Save dual fuel fixed-rate plan with Scottish Power. Gas cost a mere 2.958p per KWh and electricity was 16.105p per KWh. The standing charges were 29p per day for each fuel. It amounted to £553 for gas and £1,135 for electricity, a total of £1,688 for the year, paid for with a monthly direct debit of £153. Pricey, but we came by. It was our ‘normal’. But, the fixed rates plan was due to end on 31 October 2022.
Then the impact of the war in Eastern Europe sent inflation and especially energy costs spiralling. Boris left it for Liz Truss to deal with. Her new chancellor capped the rates so that an average household would pay no more than £2,500 per year. That sounded great (we thought we were average), so we breathed a sigh of relief.
Then Scottish Power wrote in September to remind us that our fixed rate deal would end on 31 October and that there was no better deal anywhere other than to go onto the standard variable rates.
Our new tariffs would be 10.457p per kWh for gas (a 3.5-fold increase) and 34.226p per kWh for electricity (up by 112%). The standing charge for electricity also increased to 44p per day, up by 52%.
Scottish Power’s new estimate was that we would now pay £1,599 for gas and £2,305 for electricity per year.
That’s an annual increase from £1,688 to £3,904, a whopping great 136% to find from somewhere.
They cheerfully offered to increase the direct debit to £364 per month. We declined.
So the ‘average’ household was due to pay £2,500 after the price cap. We had thought we were average consumers – a 4-person family living in a 3-bed semi with a loft conversion. Why then would we need to pay about 60% more?
What was costing so much? Could we really be consuming that much more gas and electricity?
Searching for the excess kWhs
We had to get to the bottom of it.
We could see from the Scottish Power energy bills how much gas and electricity we were using, but those were only numbers. They provided no information. Usage varied by season and the direct debit just smoothed it all into a regular monthly amount. There was no help there.
Finally, a use for that smart meter – what, not how
Two years before, when we signed up for the fixed rate energy deal, we were pushed into having a smart meter installed. It did not seem to serve any purpose, other than saving the Scottish Power the expense of sending someone round to read the old meters from time to time.
We had shoved the in-house unit into a cupboard and never looked at it. The details it displayed were not much use day-to-day, they were what they were. The smart meter seemed to be benefitting the energy company more than it did us.
Light bulb moment!
Scratching our heads, we now discovered that there was a wealth of information available in our online account on the Scottish Power website. Thanks to the smart meter it showed our gas and electricity consumption per year, per month, per day – down to the half hour! Not just the usage numbers, but graphs as well that showed how consumption varies over time.
Really useful. We started delving deeper.

The 2021 lines show the KWh consumption of that year. The 2022 consumption mirrored that of 2021 until September when we started to take action, and then it dropped.
Here are the same graphs in pounds, with the costs calculated using the new standard variable rates we were switched to.

It was clear that at the new gas and electricity rates we would realistically face well over £400 per month during the winter. During summer months we would see it dip slightly below £300 per month. Maybe that £364 direct debit amount was correct after all. Still not affordable though.
Delving even deeper we could see that daily consumption typically looked like this:

Little did we realise how significant those bumps in the gas graph would be.
And we still needed to figure out where we were consuming all that energy.
Action stations!
Buying the smart plug – you can’t manage it if you don’t measure it
First, we decided to investigate what electricity we were using. That’s where most of the money went so that’s definitely where we could save energy and money
The smart meter data and graphs showed when and how much electricity we were using, but not how. We knew all the little bits added up, but we did not know what the little bits were.
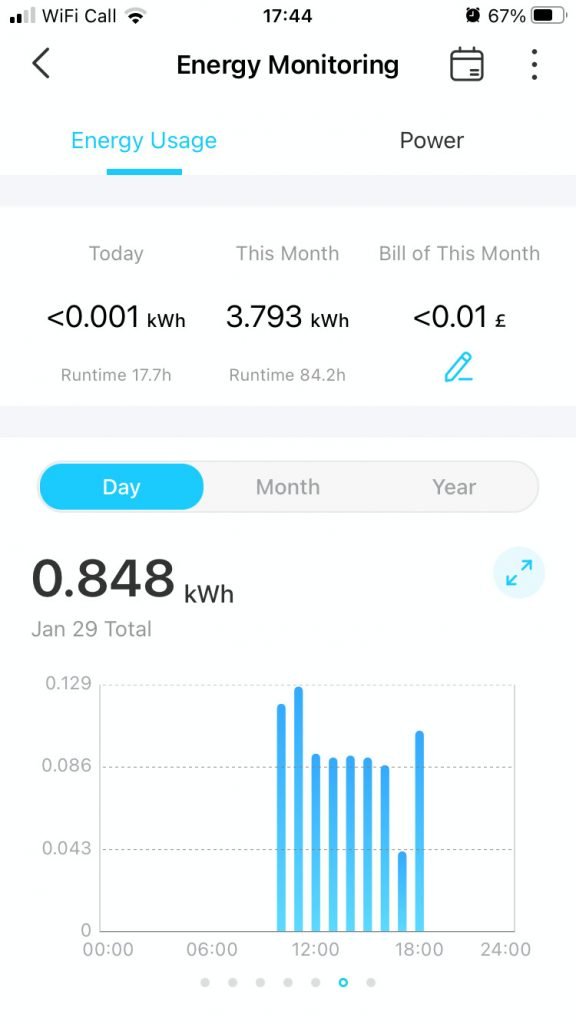
After some research on Amazon we bought a smart plug (TP-link tapo P110 Mini Smart Wi-Fi Socket Energy Monitoring) that measures the electricity flowing through it at any moment, and its mobile phone app shows statistics per hour, day, week and month. We could use that to calculate the running costs of any appliance.
Nothing was safe, the plug found all the culprits
First on our list of suspects was the freezer we had in the garage. We were economising by bulk buying from Costco and storing the frozen food in the freezer. The smart plug very quickly showed us that the freezer was using £10 electricity per month at the old rate, and that would go up to £35 per month from 1 November. So we quickly cleared out the freezer and unplugged it. We just needed to change our shopping habits…
Next was the outside lighting. We have pretty lights on the outside walls of the house and garage. They glowed their 5 old-style incandescent light bulbs @ 20W each all through the dark hours and shone at 60W each whenever someone came in range. Cars and people going past would set them off. That’s 100W every night for an average of 8 hours as a minimum, peaking to 300W for 1 to 1.5 hours each night, 365 days a year. That’s 35p per day or more that £100 per year. We replaced them all with 5W LED light bulbs and adjusted their timings and sensitivity. That led to a 80% saving right there.
We also switched from using the main oven to a halogen oven (no air fryer here, yet) and the microwave. Plus, we dug out a slow cooker that had been gathering dust in a cupboard. That led to experimenting with new recipes, which brought a bit more culinary experimenting and fun into the gloom and doom of a very cold winter. It is amazing how little electricity a slow cooker uses, even when it’s on for hours on end. More money saved there.
And so we went around the house, moving from power outlet to power outlet. We switched off or set timers for everything we could, changed light bulbs and switched off rather than let devices go on to standby. Every little bit counted, we were on a roll. The biggest electricity consumer now is a desktop gaming PC, we diplomatically retreated to prevent WW3 on condition everything is switched off when not in active use.
The smart plug worked a treat. Within a couple of weeks, we could see our electricity bill go down from September onwards, as shown in the annual graph above. Yes, we could save energy and money, and we already had hundreds of pounds in the bag.
Step on the gas
Soon we ran out of things to measure with the smart plug. The remaining electricity use was for the boiler, central heating pump, internet router, etc. There was not much we could do directly with those.
We moved on to investigate the way we used gas and how much that cost. And there we stumbled upon another huge cost saving.
Remember the regular bumps in the green line of the daily gas graph?
Initially we did not know what those bumps were. Why were we burning gas even on hot summer days?
Well, it turns out we had been heating the water all day long, 24 hours a day.
We had work done on the boiler a few years ago and the plumber said “Just leave the water on, the thermostat and insulation around the tank will keep it hot.” What an optimist he was.
The boiler would come on every couple of hours to do a quick boost of the water temperature. We only use hot water in the morning and evening so we were simply burning gas for nothing, hundreds of pounds worth a year at the new rates even if it was only an extra £1 a day. Not the way to save energy and money at all!
We quickly changed the hot water timer from ‘continuous’ to the recommended setting in the manual (‘once’) so it would be off at night but leave the water heating on during daylight hours. The night-time bumps disappeared, but we were still wasting gas during the day. Common sense prevailed and by simply changing the setting to ‘twice’, similar to the central heating, the bumps disappeared altogether. If for some reason we run out of hot water occasionally during the day we can manually boost the temperature.
One flick of a switch and we stopped a massive amount of waste.
So how did we save energy and money?
We managed to save energy and money using a smart plug. Massively, and both electricity and gas. Many pounds saved!
Had we done nothing, our above-average energy use would have continued. On top of that the rates would have more than doubled. The cost of running this household would have become totally unmanageable.
- Last year, in January 2022, we used a total of 2,825KWh of fuel or £185 at the old rates.
- Had we continued using electricity and gas at the same the same way this January 2023 that same 2,825KWh would have cost us £485 at the new standard variable rates.
- However, after all our cutbacks, we used only 1,397KWh costing £267 this January.

£267 instead of £485! That’s a massive saving.
It is still higher than we’d like to see it, but at least it is much more manageable.
What have we learned?
We came to realise that the smart meter (love it or loathe it) was actually really useful. That, plus using a smart plug to sniff out energy waste saved us a small fortune in gas and electricity.
There were big savings that quickly knocked hundreds of pounds off the bill. Additionally, all the small savings we spotted by measuring individual appliances all added up to big numbers.
Just the act of putting our energy-saving thinking caps on led to us finding big savings where we did not think there were any.